Engine Performance
The Engine Performance module visualizes time-series measurements from onboard sensors to help you monitor propulsion performance, fuel usage indicators, emissions, and navigation metrics. Use it to compare parameters over time, correlate engine behavior with operations, and spot anomalies that may require attention or maintenance.
Overview
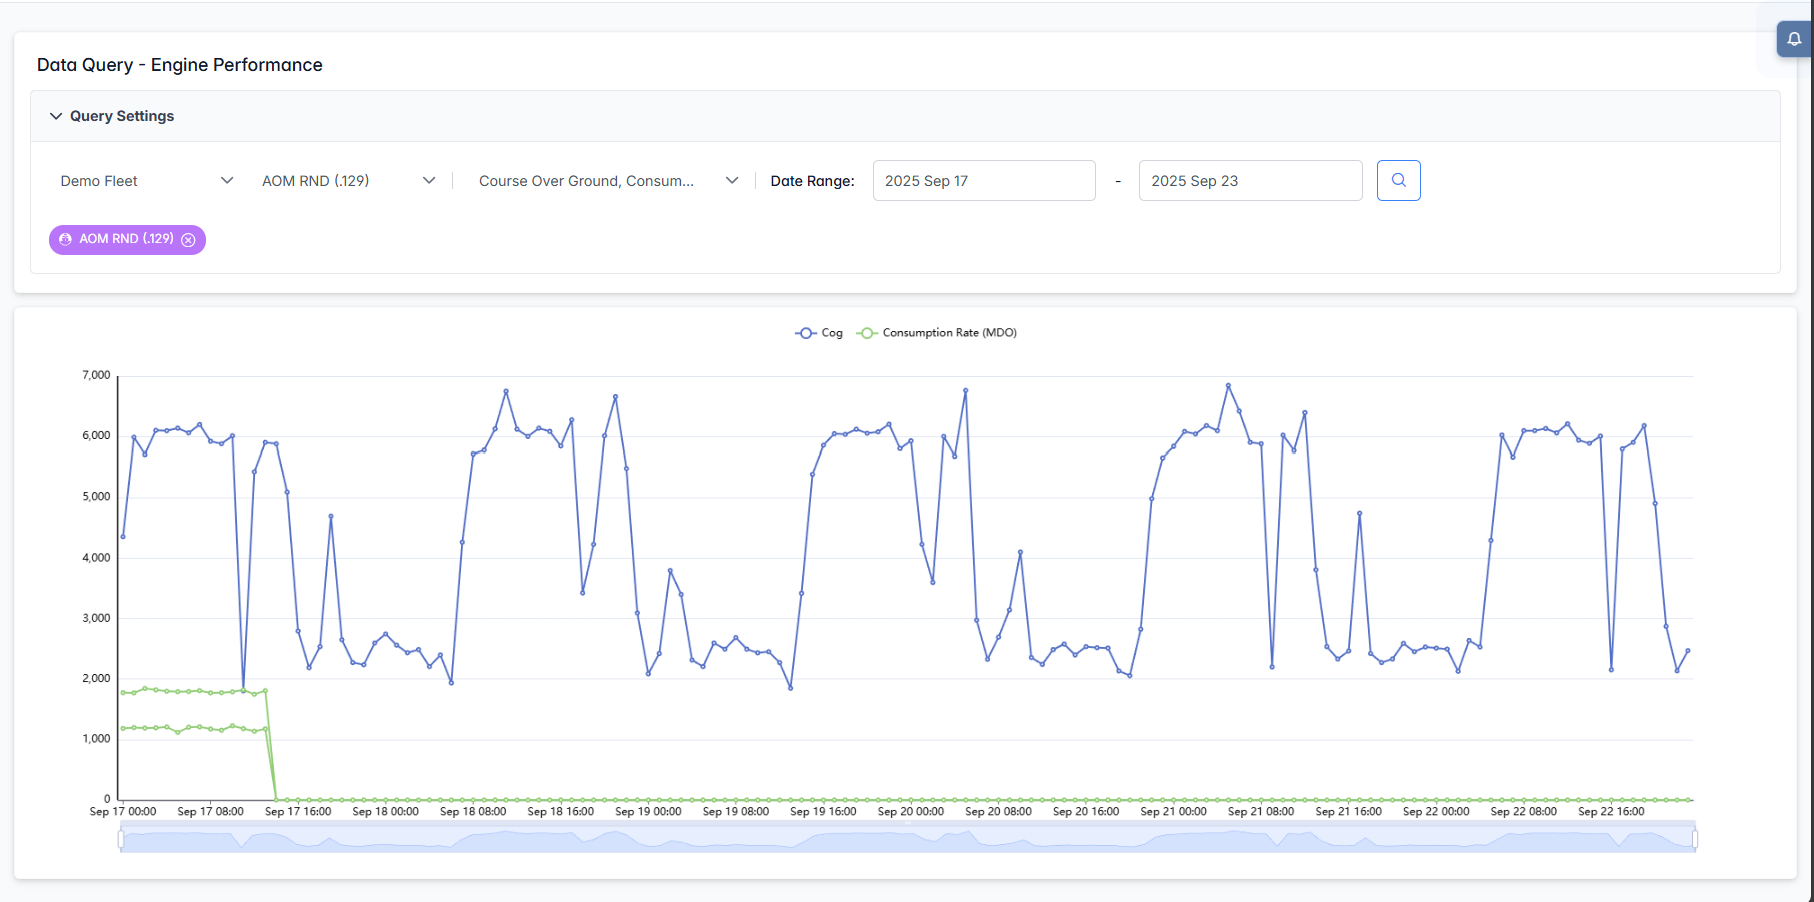
The interface consists of a Query Settings panel and a multi-series time chart. You can pick one or more parameters for the selected vessel and date range, then explore trends with interactive zoom, tooltips, and series toggles.
Query Settings
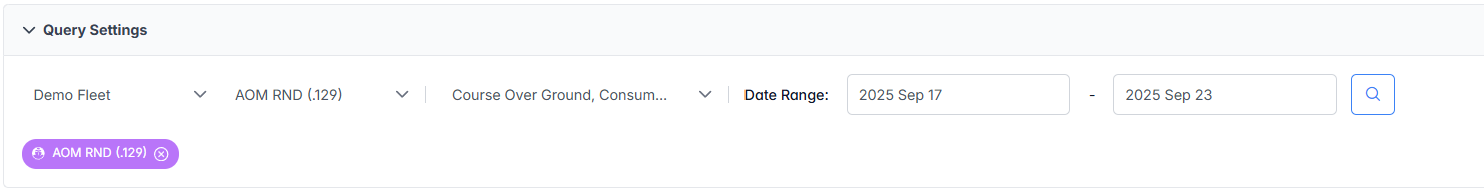
- Fleet: Choose the fleet to filter vessels.
- Vessel: Select the vessel to analyze.
- Parameters (multi-select): Pick one or more metrics to plot
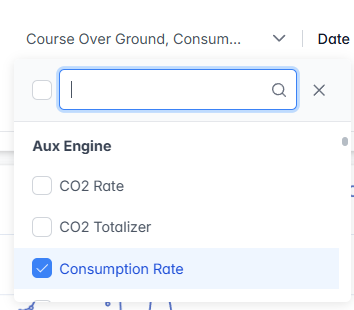
- Search within parameters: Use the search box in the dropdown to quickly find metrics.
- Date Range: Select start and end dates/times for the analysis window.
- Search button: Applies your selections and renders the chart.
Chart Area
The chart displays each selected parameter as a separate line series over time.
- Legend: Click a legend item to show/hide its series (useful to focus on one or two lines).
- Tooltip: Hover to see exact timestamped values for visible series.
- Time Brush (mini timeline): Drag the handle(s) to zoom into a specific period; drag again to pan along the timeline.
- Reset view: Expand the brush to the full width or re-run the query to return to the full period.
- Mixed scales reminder: Each metric keeps its own native units. When combining high- and low‑magnitude signals, smaller signals may look flat. Select related metrics or run separate views for clearer comparison.
Use Engine Performance to quickly explore relationships between navigation, engine load, fuel usage, and emissions so you can diagnose issues, validate operations, and improve overall efficiency.